· Xiaojing Yang · Explainability and Responsible AI · 10 min read
中文Training Data Attribution for NLP Research
A research-oriented guide to training-data attribution: attribution units, utility functions, Shapley values, influence methods, causality, scalability, and uncertainty.
Core idea
Training-data attribution asks which parts of the training data are responsible for a model behavior, but the answer depends on the attribution unit, the utility function, the intervention, and the uncertainty we are willing to model.
This note is written for my own research and interview preparation. It connects training-data attribution to multilingual/domain machine translation, especially the kind of group-level attribution I use when studying English—Norwegian domain adaptation.
The question is simple to say:
Which training data influenced this model behavior?
The difficult part is making every word in that question precise.
1. What is training-data attribution?
Training-data attribution tries to explain a model behavior by assigning influence, contribution, or value to training data.
In NLP, the behavior may be:
- a translation metric such as BLEU, chrF, or COMET;
- terminology preservation in a domain-specific MT system;
- a model preference for Bokmål-like or Nynorsk-like output;
- a specific generated answer;
- a hallucination or factual error;
- a bias pattern across languages, domains, or demographic groups.
So training-data attribution is not only about finding a suspicious example. It can also ask which data sources, domains, languages, or written-standard groups shape a model’s behavior.
Global attribution
Which data groups influence overall model behavior? Example: which written-standard data group changes BLEU, chrF, TermF1, or output style?
Local / instance attribution
Which training examples are most related to one specific prediction or generated answer?
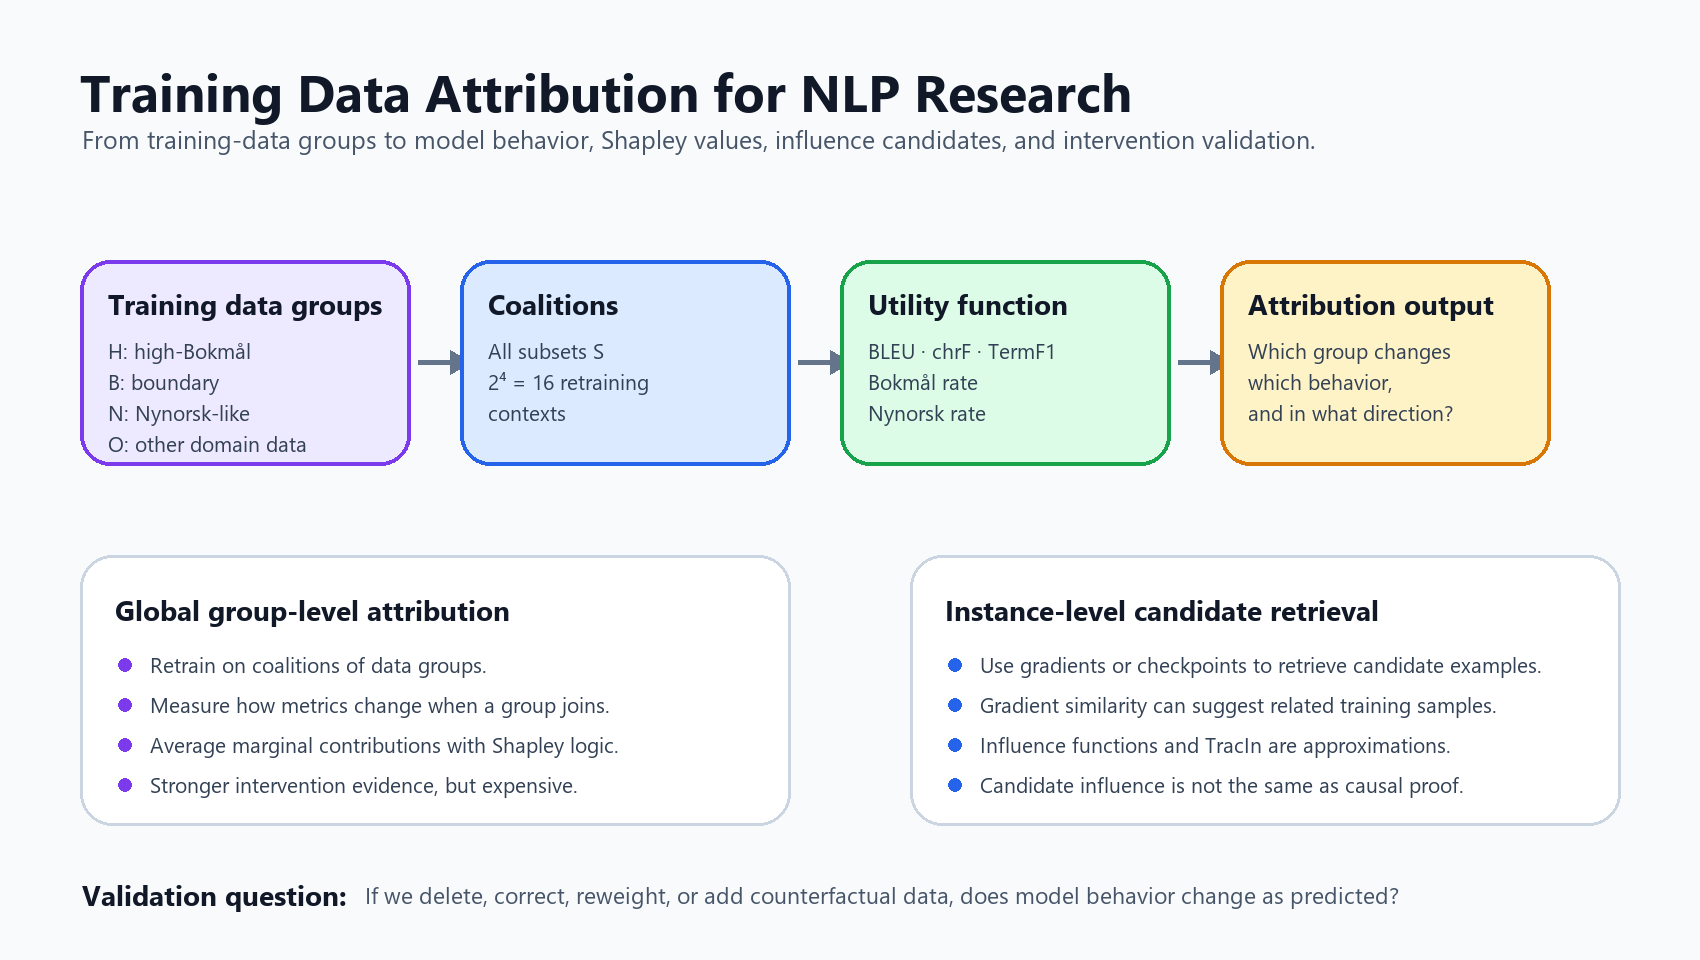
My thesis-style setting is mainly global group-level attribution. I want to know how groups of written-standard training data affect domain MT behavior. Instance-level retrieval can still be useful, but it is a candidate-finding step, not automatically causal proof.
2. Attribution unit: what exactly receives credit?
The attribution unit is the object we assign contribution to.
It can be:
| Unit | Example | Typical question |
|---|---|---|
| dataset | all domain data | Did the domain corpus help? |
| source | NPD vs web data | Which source mattered? |
| domain | petroleum vs general text | Which domain caused the shift? |
| language/style group | Bokmål-like vs Nynorsk-like | Which written standard shapes output? |
| document | one PDF or report | Which document influenced behavior? |
| example | one sentence pair | Which pair influenced this translation? |
| token/feature | one term or phrase | Which phrase drove this output? |
For my project, the unit is:
written-standard training-data groupsThat choice is not just administrative. Attribution is only interpretable if the group boundary is meaningful. A clean group can support a clear claim. A boundary group is a useful warning: if the group mixes styles or data qualities, its attribution may be difficult to interpret.
3. Utility function: what behavior are we explaining?
Attribution needs a utility function. The utility defines what counts as model behavior.
In a simple classification setting, utility might be accuracy. In my domain MT setting, one scalar is not enough.
I would describe the utility as multi-dimensional:
v(S) = (
  BLEU,
  chrF,
  TermF1,
  Bokmål output rate,
  Nynorsk output rate
)
Here, S is a coalition of data groups used for training or adaptation.
The crucial point is:
The same data group can help one utility and hurt another.
For example, a Nynorsk-like group may:
- improve BLEU;
- reduce TermF1;
- increase Nynorsk output rate;
- shift style in a way that is good for one evaluation slice and bad for another.
This is why I call the attribution multi-faceted. If I compress everything into one score, I may hide the most interesting result.
4. Coalition and marginal contribution
A coalition is a subset of training-data groups. If I have four groups:
G = {H, B, N, O}where, for example:
H= high-Bokmål;B= boundary group;N= Nynorsk-like;O= other domain data;
then there are:
2^4 = 16possible coalitions, including the empty set.
Examples:
| Coalition | Meaning |
|---|---|
| ∅ | no domain group |
| {H} | high-Bokmål only |
| {H, N} | high-Bokmål + Nynorsk-like |
| {H, B, N, O} | all groups |
The model behavior under coalition S is written as:
v(S)The marginal contribution of a group g in context S is:
v(S ∪ {g}) - v(S)Plain English:
If the current training-data combination is S, how much does model behavior change when I add group g?
For example:
v({H, N}) - v({H})means: what changes when I add the Nynorsk-like group on top of high-Bokmål data?
5. Shapley value: contribution across contexts
Leave-one-out ablation asks one question:
What happens if I remove group g from the full data?That is:
v(G) - v(G \ {g})Shapley value asks a broader question:
Across all possible coalition contexts, what is group g's average marginal contribution?The formula is often written as:
φ_g = Σ_{S ⊆ G \ {g}} w(S) [v(S ∪ {g}) - v(S)]I do not need to recite the formula in an interview, but I do need to explain what it does.
One context: remove g from the full set.
All contexts: average the contribution of g across possible coalitions.
Why is Shapley useful?
- It is more comprehensive than a single ablation.
- It captures context dependence.
- It can reveal interactions between data groups.
- It has a principled game-theoretic interpretation.
Why is it hard?
- Exact computation is exponential.
- With 4 groups, exact Shapley needs 16 coalition utilities.
- With 20 groups, there are 1,048,576 coalitions.
- With 100 groups, exact enumeration is impossible.
That scalability problem is not a footnote. It is one of the main research questions.
6. Correlation, attribution, and causality
This distinction is interview-critical.
| Concept | What it means | What it does not prove |
|---|---|---|
| similarity | two examples look similar or have similar gradients | one caused the other |
| attribution | a method assigns behavior change to data | the mechanism is fully causal |
| causal evidence | changing data changes behavior as predicted | universal generalization |
My group-level coalition retraining provides stronger intervention evidence because it actually changes the training data and observes model behavior.
Gradient similarity is weaker. It can retrieve candidate training examples that may be related to a test behavior, but it cannot by itself prove:
This training example caused this answer.The honest claim is:
These examples are plausible influence candidates under this approximation.7. Intervention validation
The cleanest way to validate attribution is to intervene.
A practical validation loop is:
- identify high-attribution data;
- delete, correct, reweight, or add counterfactual examples;
- retrain or fine-tune;
- observe whether behavior changes as predicted;
- compare against random or size-matched baselines.
Possible interventions:
| Intervention | Example |
|---|---|
| deletion | remove high-impact group or examples |
| correction | fix mislabeled or noisy examples |
| reweighting | reduce the weight of over-dominant data |
| counterfactual addition | add examples with alternative style or terminology |
| retraining | rerun training under the intervention |
For my setting, a size-matched random baseline is important because group size is a confounder. If a large group appears influential, I need to ask whether its effect comes from identity, quantity, quality, or all of them.
8. Gradient similarity, Hessian, influence functions, and TracIn
Instance-level attribution often uses gradients.
For a training example z_i, the gradient is:
g_i = ∇_θ L(z_i; θ)Intuition:
The gradient points in the parameter direction that would reduce the loss for that example.
If a training example and a test example have similar gradients, they may push the model in similar directions.
cos(g_train, g_test)But gradient similarity is not the same as causal influence.
Influence functions
Influence functions ask:
If I upweight or remove one training example slightly, how would the model parameters and test loss change?
A classic expression contains:
- ∇_θ L_test^T H^{-1} ∇_θ L_trainwhere H is the Hessian, the matrix of second derivatives of the loss.
Intuition:
- gradient tells me the local direction;
- Hessian tells me the local curvature;
- inverse Hessian estimates how parameter changes propagate.
The limitation is that this is a local approximation. Large neural networks are non-convex, expensive, and sometimes unstable under influence-function assumptions.
TracIn
TracIn avoids inverse Hessian computation. It traces training through checkpoints and uses gradient similarity across the training trajectory.
The core idea:
If a training example repeatedly pushes the model in a direction that helps a test example during training, it receives high influence.
Compared with influence functions, TracIn is often easier to scale because it uses saved checkpoints and gradients. But it is still an approximation, not the same as retraining after deletion.
9. Scaling attribution
Exact Shapley does not scale to many groups or examples.
Three scalable directions are especially relevant:
Monte Carlo Shapley
Instead of enumerating all coalitions, sample random orders of adding groups. Each time a group is added, record the utility change. Average over many sampled permutations.
Questions to ask:
- how many samples are enough?
- how large is estimator variance?
- when should sampling stop?
- can we build confidence intervals?
- which coalitions are most informative?
Surrogate models / datamodels
Training a model for every coalition is expensive. A surrogate or datamodel learns:
S → v(S)Given which data are included, it predicts the model behavior that would result from training on that subset.
This can make attribution cheaper, but it introduces a new risk:
surrogate attribution is only as reliable as the surrogate’s prediction of retraining behavior.
Hierarchical attribution
A practical research direction is to search in levels:
data source → document → example → token / phraseFor example, first identify that a data source is influential, then narrow to documents, then examples, then terminology or style patterns.
This is a strong direction for doctoral research because it combines scalability, interpretability, and intervention validation.
10. Uncertainty: bootstrap, bias, variance, and random seeds
Attribution estimates are not fixed truths. They have uncertainty.
Bootstrap confidence intervals
Bootstrap resamples the evaluation set with replacement and recalculates metrics or attribution estimates.
In my setting, bootstrap mainly measures:
uncertainty from test-set sampling under fixed trained modelsIt does not fully cover:
- training randomness;
- data grouping uncertainty;
- attribution estimator uncertainty;
- hyperparameter search uncertainty.
Bias and variance
Here, bias means statistical estimator bias, not social bias.
| Term | Meaning |
|---|---|
| estimator bias | whether the average estimate deviates from the true target |
| variance | how much the estimate changes across repeated samples |
For Monte Carlo Shapley, I would ask:
- is the estimator unbiased?
- does variance shrink as samples increase?
- how much compute buys how much precision?
Random seed
Random seeds affect initialization, data order, dropout, optimization trajectory, and final model behavior. Three seeds can reveal instability, but three seeds are still limited evidence.
11. Confounding and generalization
Confounding is one of the biggest risks in data attribution.
If a group appears influential, the effect may come from:
- the group’s identity;
- its size;
- data quality;
- task difficulty;
- duplicated templates;
- label or alignment errors;
- domain coverage;
- written-standard imbalance.
Size-matched random baselines help test whether group size alone explains the result. But they do not solve every confounder.
The correct generalization claim is narrow:
Under this English—Norwegian domain MT setup, with these written-standard groups and this training protocol, I observed stable attribution patterns.
The incorrect claim would be:
This proves all LLMs, languages, and pretraining corpora behave this way.
Research credibility comes from saying exactly what the evidence supports.
12. How I would explain my project in an interview
If someone asks what my project does, I would say:
My project studies training-data attribution for English—Norwegian domain machine translation. Instead of asking only whether domain data improves the model, I ask which written-standard data groups contribute to which behaviors. I define utilities such as BLEU, chrF, terminology F1, and Bokmål/Nynorsk output rates. Then I retrain or evaluate models under different coalitions of data groups and use Shapley-style marginal contributions to estimate group-level effects.
If they ask why group-level attribution:
Single-example attribution is expensive and noisy for large neural models. Group-level attribution is more interpretable for my research question because I care about written-standard data groups, not only individual sentence pairs.
If they ask why Shapley:
Leave-one-out ablation measures one context: removing a group from the full data. Shapley averages marginal contribution across coalition contexts, so it better captures context dependence and interactions between data groups.
If they ask about causality:
My coalition retraining gives stronger intervention evidence than pure similarity methods, because I actually change the training data and observe behavior. But I would still avoid overclaiming universal causality; the claim is conditional on the data, grouping, model, and training protocol.
13. Study order
For interview preparation, I would study in this order:
- attribution unit, utility, coalition;
- marginal contribution;
- Shapley value;
- ablation vs Shapley;
- attribution vs causality;
- deletion / retraining validation;
- gradient and cosine similarity;
- influence function and Hessian;
- TracIn;
- Monte Carlo Shapley;
- surrogate models / datamodels;
- bootstrap, bias, variance, confidence intervals.
Takeaway
Training-data attribution is not one method. It is a research framework:
define the unit
define the behavior
intervene on data
measure changes
estimate contribution
validate uncertainty
limit the claim
For my work, the most important habit is not memorizing formulas. It is being able to explain what each attribution result means, what it does not mean, and how I would validate it through data intervention.
References and further reading
- Shapley, L. S. A Value for n-Person Games
- Data Shapley: Equitable Valuation of Data for Machine Learning
- A Distributional Framework for Data Valuation
- Understanding Black-box Predictions via Influence Functions
- Estimating Training Data Influence by Tracing Gradient Descent
- Google Research: TracIn
- Datamodels: Understanding Predictions with Data and Data with Predictions
- COMET: A Neural Framework for MT Evaluation